C19 Notes

Drivers of epidemic dyamics using NHS Covid App for data

Author Topic: Drivers of epidemic dyamics using NHS Covid App for data  (Read 1322 times)

stog

  • Administrator
  • Full Member
  • *****
  • Posts: 207
    • soul-trade.com
Drivers of epidemic dyamics using NHS Covid App for data
« on: July 15, 2024, 04:40:53 PM »
Drivers of epidemic dynamics from daily digital COVID measurements
Anonymised data from the NHS COVID-19 contact tracing app provided rich insights into the drivers of the epidemic, at remarkable speed.
https://michellekendall.github.io/2024/07/11/Drivers-of-epi-dynamics/

stog

  • Administrator
  • Full Member
  • *****
  • Posts: 207
    • soul-trade.com
Re: Drivers of epidemic dyamics using NHS Covid App for data
« Reply #1 on: July 15, 2024, 04:52:03 PM »
Image

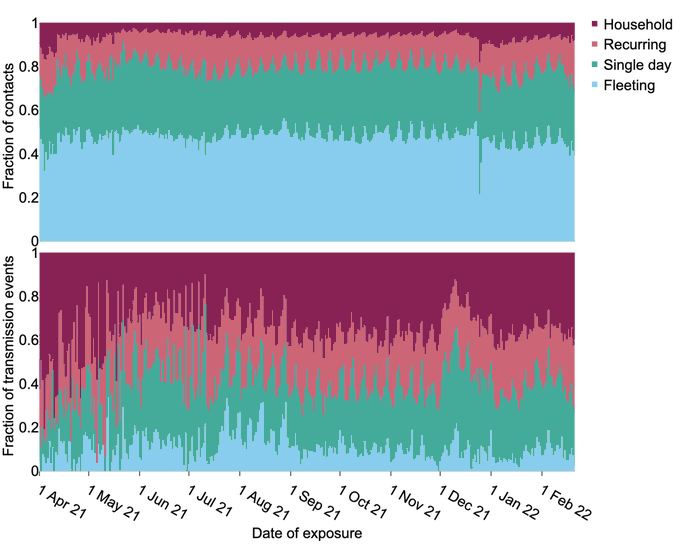
"figure shows daily analysis of the relative contributions of different "settings" for epidemic spread, April 2021 - March 2022.
 
Upper = types of contact for the average person with COVID-19,
lower = COVID-19 transmissions detected by the app"
this  from X's @mishkendall

==

Household contacts (more than 8 hours per day) accounted for only 6% of contacts but 39% of transmission events,
whereas fleeting interactions (less than half an hour) accounted for 48% of contacts but only 12% of transmission events.

The repeating wave patterns show how types of contact vary by day of the week. No prizes for spotting Christmas day!"

see her Blog https://michellekendall.github.io/blog/
« Last Edit: July 15, 2024, 04:53:47 PM by stog »

stog

  • Administrator
  • Full Member
  • *****
  • Posts: 207
    • soul-trade.com
Re: Drivers of epidemic dyamics using NHS Covid App for data
« Reply #2 on: July 15, 2024, 06:01:59 PM »
sharp spikes in transmission in England during last Euros, 2021